

This research was a collaboration between CDPR and Finance for Development Lab, Paris School of Economics.
1 Introduction
Pakistan’s economy has suffered from erratic growth, recurrent trade deficits and several balance of payment crises over the past three decades. During the same period, inflows of overseas remittances have increased significantly. Remittances represent an important lifeline for migrants’ families, but because they represent unrequited inflows of foreign currency, it has been asked whether they contribute to a phenomenon known as Dutch Disease (DD), whereby an economy stagnates after receiving inflows of large foreign currency from a single source.
Potential sources for DD are natural resources, concessional borrowing, foreign aid, FDI, and remittances. The term itself refers to 1960s Netherlands, whose economy slumped following the discovery of offshore oil. DD involves an appreciation of the real exchange rate, loss of international competitiveness, and a shift in the economy from more productive tradeable to less productive non-tradeable sectors. Such shifts have detrimental effects on a country’s growth rate and, should the source dry up, its balance of payments.
Over the years, additional symptoms have been identified with DD. One is an increase in fiscal profligacy; as the initial improvement in a country’s balance of payments leads to better sovereign debt rating, it encourages the government to borrow and spend more. Remittances can induce DD effects directly. Recipients might increase consumption spending and reduce labour supply. The first effect means lower savings and investment and the second means higher production costs.
DD, however, is not inevitable. Whether it occurs depends on an economy’s structure, openness, competitiveness, diversity and maturity, as well as its fiscal and monetary policies. Jafarey et.al. (2024) have investigated these effects for Pakistan. This article summarises some of their findings.
2 Patterns of emigration and remittances
Emigration from Pakistan has gone through three phases: i) 1950s-1970s: it was mainly towards developed countries, especially the United Kingdom; ii) 1970s-1990s: the Gulf countries became destinations but emigrant numbers remained within the low 100,000s; iii) 2000 onwards: emigration took off, almost all to the Gulf Cooperation Council (GCC) countries.[1]
Figure 1 shows annual emigration from Pakistan, with a sharp increase in the early 2000s. From 78,000 emigrating in 1999, numbers doubled to 147,000 in 2002. The flow of remittances matches that of emigration almost perfectly until 2017, when they continued to grow even as emigration numbers dipped, even during the pandemic.
The dramatic increase in emigration followed a decade of economic dysfunction in Pakistan. Whereas growth in per-capita GDP had averaged 3% annually from 1961-1992, it fell to 0.35% per year in 1992-2002 (WDI Database). The sectoral contribution of manufacturing and to a lesser extent, services, declined while that of agriculture increased.[2] Official unemployment hovered around 4%–6%, up from 1%-3% in most of the preceding years (WDI Database). The incidence of poverty almost doubled.
Following the October 1999 army takeover, a series of reforms were enacted that averted some of the most disastrous eventualities: inflation and external debt both came down and economic growth returned to pre-1992 levels by 2003. Yet since then, the economy has been plagued by volatile growth and the persistence of structural weaknesses that first emerged during the 1990s.
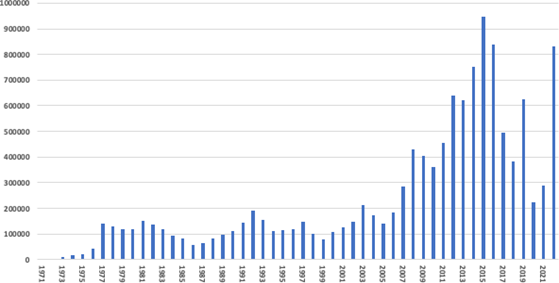
Figure 1: Emigration from Pakistan, 1971-2022
Source: Bureau of Emigration and Overseas Employment, Pakistan
Figure 2: Remittances, 1976-2022
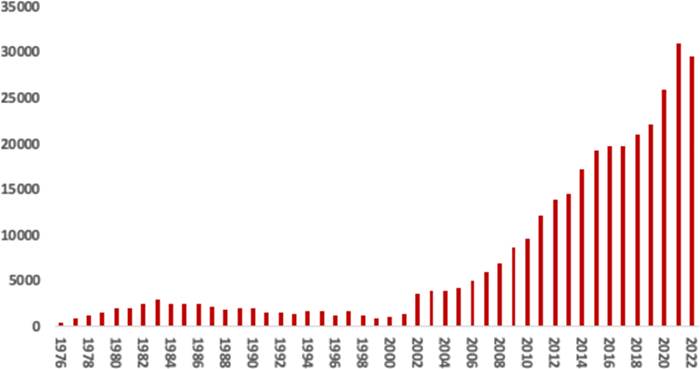
Source: World Development Indicators (WDI)
3 Evidence of Dutch Disease:
We used local projection (LP) methods to analyse the effects of remittances on a number of indicators. LP is a semi-parametric procedure that is increasingly used as it is less vulnerable to misspecification bias. LP analysis projects the effects of a shock to an independent variable, e.g. remittances, on a dependent variable, e.g. the real exchange rate, over a given number of periods following the shock.
We found that a 1% increase in remittances is followed by
- an appreciation of 0.1%, statistically significant at the 10% level, in the nominal rupee-dollar exchange rate and 0.05% in the real exchange rate within 5-6 months, rising to 0.3% and 0.2% respectively over 5 years;[3]
- an immediate decrease of 0.16%, also significant at the 10% level, in monthly exports and an insignificant decline in monthly imports;
- an increase in final consumption expenditures of 0.15% over 2.5 years;
- an increase of 0.2% in government expenditures;
- a decrease, albeit insignificant, in labour force participation (LFPR).
The first four effects are consistent with DD, even if their magnitudes appear to be minor. While the predicted effect of remittances on LFPR turned out to be insignificant, male LFPR has been gradually declining since the 1980s. In addition, as Figure 3 shows, skilled workers make up an increasing fraction of emigrant numbers since at least 1989.
We did not find analogous effects for the same variables for India and Bangladesh. In Bangladesh, there was in fact a tendency, although insignificant, for nominal exchange rate depreciation to follow an influx of remittances.[4]
These findings suggest that Pakistan’s economy is especially vulnerable to DD and the reason for that vulnerability might lie in the ossification of its economic structures in recent decades.
Figure 3: Skill Composition of Migrants, 1981-2009
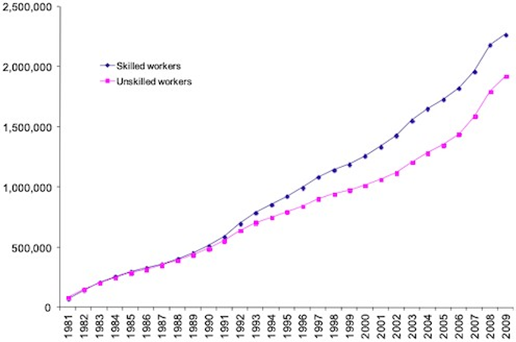
Source: Kock and Sun (2011)
4 Structural hysteresis
In this section, we shall consider how economic structures have evolved since 1990 in Pakistan, India and Bangladesh. We choose 1990 as the starting period as this is just before Pakistan’s economy started faltering.
Figure 4 shows the structural evolution of the three economies, as measured by shares of industry, agriculture and services in GDP.
India and Bangladesh started with higher agriculture shares than Pakistan, but have both reduced this share. Pakistan, where the share of agriculture declined rapidly in the 1960s, has achieved barely any further reduction since 1992. While Bangladesh has steadily increased industry’s share which now exceeds India’s, both Pakistan and India have seen industry’s share decline in recent years.
For India the decline in industry reflects a fairly successful transition to exportable services. While Pakistan too has seen growth in service’s share of GDP, the implications are different from those in India.
Figure 4: Sectoral Shares of GDP, 1990-2021.

Source: WDI
Figure 5 compares the importance of services to each economy. In 1990, the three countries had roughly similar ratios of service exports to total exports and to GDP. Since then, India has clearly moved towards service exports which accounted for close to 40% of India’s export earnings and 8% of its GDP in 2020. In Pakistan, the corresponding figures were approximately 20% and 2% respectively and these were not much changed from 1990.[5]
Figure 5: Service Exports as % of Total Exports (Left), % of GDP (Right).
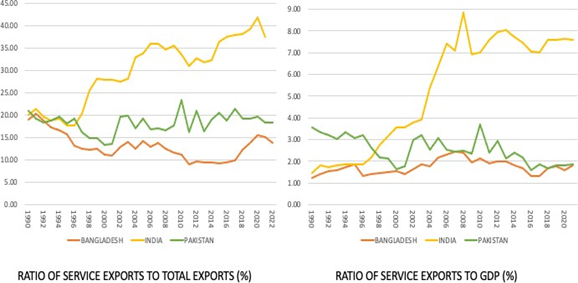
Source: WDI
In Bangladesh, manufacturing has been the engine of growth. Figure 6 compares manufactured exports relative to GDP for all three countries, between 1990 and 2013. We see that Pakistan’s ratio started off higher but it has not only fallen behind, it has actually declined, while Bangladesh has surged ahead.
Figure 6: Manufactures Exports as % of GDP
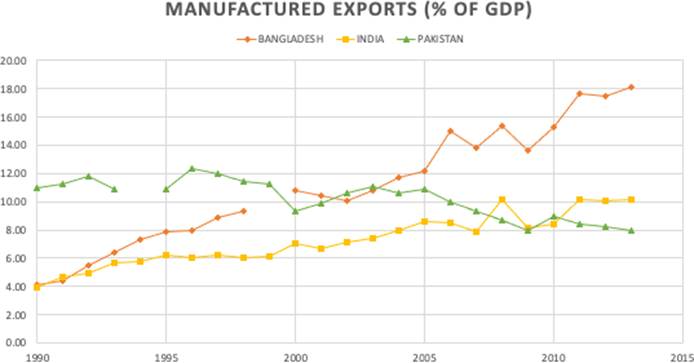
Source: WDI Database
The extent to which growth of the service sector can be associated with DD will depend on how the balance of tradeable to non-tradeable activities evolves within that sector. The greater the share of non-tradeable services the more likely is it that growth of services is a sign of Dutch Disease. We can infer something about that composition by looking at the ratio of service exports to service value-added, both measured in dollar terms. Figure 7 shows this.
Figure 7: Services Exports as % of Services Value-Added (%)
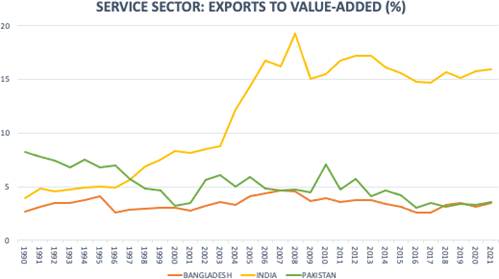
Source: WDI
Starting with exports comprising only 4% of services output, India has raised this ratio to 16%. In Pakistan, things have gone in reverse, from 8% in 1990 to 4% in 2021. Bangladesh has not experienced much change in this ratio, unsurprisingly given its push towards manufacturing. Again, Pakistan stands out as the country that has been unable to grow its tradeable sectors, via either services or manufactures.
5 Root causes and possible remedies
Given that Pakistan’s economic doldrums started well before its exposure to large inflows of remittances, the latter are highly unlikely to be the root cause of its vulnerability to Dutch Disease, albeit they might provoke some of its the symptoms. The underpinning cause appears to be a structurally weak economy that has failed to develop international competitiveness in any of its sectors. A recent World Bank study reported that between 1991-2021, average labour productivity in Pakistan increased from about $3200 to $4700, a multiple of 0.5; over the same period, labour productivity in Vietnam went from $1200 to $6000, a multiple of 5 (World Bank, 2022).
The following steps can pull Pakistan out of stagnation and DD.
More exporting firms
Competition in international markets encourages innovation and increases productivity. Firms that export are more innovative and better managed than those selling only domestically.
Upgrading public infrastructure
A well-designed public investment program that crowds in private investment is key. The reality is that fiscal deficit targets have been met largely by cutting back public investment instead of increasing revenues and reducing untargeted subsidies. Improvements in inland transport and port operations have been postponed.
Building agriculture resilience
Low crop yields and climate change induced increase in heat and rainfall variability pose additional challenges affecting competitiveness in agriculture. Pakistan needs an effective agriculture research network to promote green innovation and re-orienting of agriculture subsidies.
Attracting FDI
FDI helps promote innovation in management practices and production technology, key drivers of productivity growth World Bank (2022) estimates that Pakistan has an untapped potential for attracting US$2.8 billion worth of FDI annually. Privatization of SOE’s, a well-designed program for upgrading the trade infrastructure, farming and food processing and textiles present opportunities for realizing the productivity enhancing FDI potential.
Raising female labour force participation
Transformative growth cannot happen when a large section of the population is out of the labour force. In Pakistan this applies to almost 80% of working-age females. Rising female labour force participation rate has been an important factor in Bangladesh’s transformation. While Pakistan has actually done better on this measure in recent years than India, more needs to be done. It is estimated that achieving Bangladesh’s FLPR could increase GDP by 20 percent, a substantial jump in productivity (World Bank, 2022).
References
Chowdhury, M.B. and F. Rabbi (2014): Workers’ remittances and Dutch Disease in Bangladesh, The Journal of International Trade and Economic Development 23(4), 455-475.
Jafarey, S., A.K. Maak, I. Nabi and I. Qureshi (2024): Are overseas remittances a source of Dutch Disease in Pakistan, paper prepared for a symposium on Pakistan, Egypt and Tunisia, March 2024, Paris School of Economics.
Kock, U. and Y. Sun (2011): Remittances in Pakistan: Why have they gone up and why aren’t they coming down? IMF Working Paper 11/200, International Monetary Fund, Washington DC.
World Bank (2022): From swimming in sand to high and sustainable growth, mimeo, World Bank, Washington DC.
[1] The GCC is a group of five countries clustered on the Arabian Peninsula: Bahrain, Kuwait, Oman, Qatar, Saudi Arabia and the United Arab Emirates. Between 2008-2016, although there were Pakistani migrants in over 50 countries, some 97% of them went to the GCC (ILO,2016).
[2] The share of agriculture in GDP went from 43% in 1992 to 52.8% in 2002, while that of industry fell from 22.6% to 17.7% over the same years (WDI Database).
[3] The caveat is that local projection estimates become less and less reliable as the time horizon gets longer.
[4] Chowdhury and Rabbi (2014) suggest that the Bangladesh Bank mitigates real appreciation of Bangladesh’s currency by “devaluing” the nominal exchange rate in response to remittances.
[5] It is worth noting that while India’s service sector has become comparatively far more important for India’s exports than in the other two countries, its overall share in India’s GDP remains lower than in the other two; in 2021, services contributed 47.5% of GDP which was less than their share, at 51.3%, in Pakistan or at 52.1% in Bangladesh (WDI Database).