Two years on, the Covid pandemic is not receding in the rear-view mirror. Instead, the conflict between Russia and Ukraine and the ensuing threat of stagflation have compounded the economic and social harm inflicted by the disease outbreak. The World Bank, the OECD, and the WTO have revised downward their projected growth rates for global GDP and trade for 2022 and 2023[1]. Worries abound that several developing countries risk tumbling into debt crises – and a few like Sri Lanka already have[2]. Hard won gains at reducing poverty could be partially surrendered if the lingering effects of the pandemic, the European conflict, persisting trade tensions between major economies and the aftereffects of disrupted supply chains depress longer term growth prospects. And then, of course, there is the rising probability that because of climate change every succeeding year will feature more severe weather events than the preceding one.
The 2020s started out on an ominous note and the balance of the decade does not promise to be smooth sailing. Global recovery could surge in the second half of the decade if new variants of the corona virus prove to be weaker and less infectious, if geopolitical tensions subside, if deglobalization can be averted, and if green and digital technologies revive investment, productivity and growth momentum. But the future is hostage to many ‘ifs’. In the face of so much uncertainty, every developing country needs to take stock of its strengths and weaknesses and to focus policy attention on vulnerabilities that undermine growth potential and social stability. A start at assessing capabilities can be made by benchmarking against a representative sample of other developing countries.
Low- and middle-income countries can serve as a mirror for Pakistan, show how well positioned it is to weather storms to come while sustaining adequate rates of growth and identify pressure points deserving the attention of policymakers. A methodology for such stocktaking was devised by Simon Kuznets, one of the earliest recipients of the Nobel Prize in Economics.
Kuznets’ pathbreaking study of how modern economic growth evolves was published in 1966[3]. In it and in earlier monographs, he identified the salient characteristics of economic change based on data from national accounts, the construction of which he pioneered.[4] Because data on developing countries was sparse, Kuznets’ focus was largely on the industrialized economies and what he emphasized was the relative uniformity of the growth process in countries with widely varying institutions and cultures. Kuznets’ investigation triggered an outpouring of comparative analysis and as the volume of quantitative information on developing countries increased, researchers turned their attention to tracking change in the less developed parts of the world.
One question that loomed large was whether developing countries would tread the same path that the industrialized ones had done. In other words, was there a normal pattern to development and structural change. This was most extensively explored by Hollis Chenery and his collaborators at the World Bank from the late 1960s through the 1980s. They went on to identify certain enduring uniformities and “stylized facts of development”.[5] In Chenery’s (1971) words, “Rising income is associated with systematic variations in almost every feature of the economic structure—for example, rates of saving and investment, the types of commodities produced and consumed, the patterns of trade, and the use of capital and labor… To continue growing, however, a country must not only increase its resources but must also shift them according to changing patterns of demand and opportunities for trade.”[6]
Although research on development has moved on, economists continue to benchmark the level and pace of development with respect to certain stylized facts distilled from the collective experience of a large sample of countries. A normal pattern of growth and development helps to establish what seems to work for most and to identify outliers to better understand the factors responsible for significant deviations above and below the norm and to derive lessons for the majority[7].
In this note, my intention is to try and determine whether Pakistan is following a “normal” development path or whether it is an outlier. In attempting this, I use 16 indicators covering the period from 2000 through 2020, which broadly bracket a country’s performance, and match Pakistan against the average for low- and middle-income countries. Averages undoubtedly conceal a fair amount of variation, but this approach does provide useful clues and can be a prelude to a more fine-grained analysis. The data used are obtained from the World Bank’s World Development Indicators accessed in June 2022.
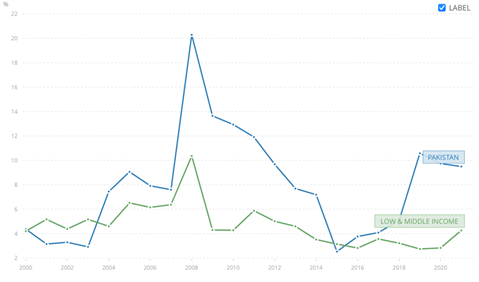
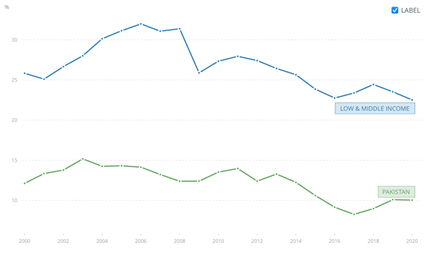
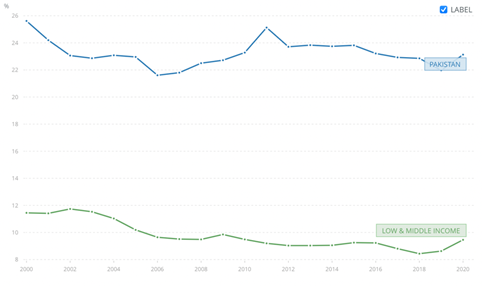
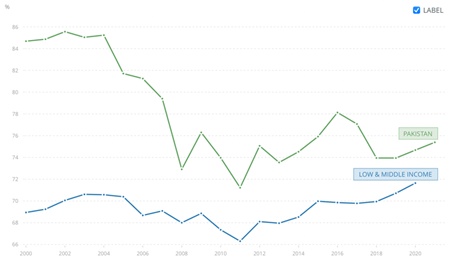
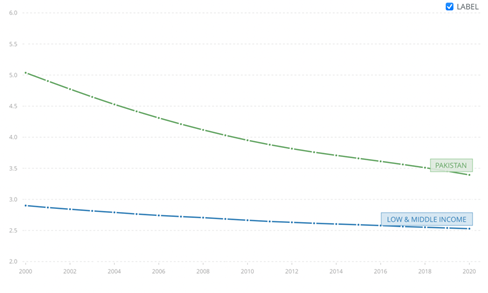
Macroeconomic performance indicators provide the first cut. Pakistan’s GDP growth has fallen below the average for almost the entire period (Figure 1). It briefly rose above the rest in 2014 only to subside four years later. However, at least according to this indicator, Pakistan is fairly close to the norm. But it falls short of the rest in other respects. Growth of per capita GDP is less than others (Figure 2). Gross capital formation is much lower with the gap widening since 2007 (Figure 3). The same is true for gross domestic savings (Figure 4). Pakistan saves much less than its peers and past trends suggest that the sudden upturn in 2020 is unlikely to persist. Around the turn of the century, consumer prices in Pakistan were rising more slowly, but that changed after 2003. Inflationary pressures mounted and except for a dip in 2015, have exceeded those of comparators in some years by a wide margin (Figure 5). The average share of exports as a percent of GDP in low- and middle-income countries has ranged between 23 percent and 32 percent while Pakistan’s share never rose above 15 percent and in 2020 was down to 10 percent a difference of 13 percentage points (Figure 6).
Figure 1: GDP Growth rates Low- and Middle-Income Countries and Pakistan: 2000-2020
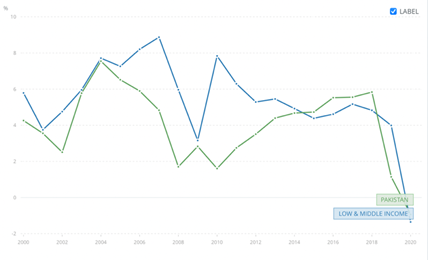
Source: WDI 2022
Figure 2: Growth of GDP per capita (% annual rate)
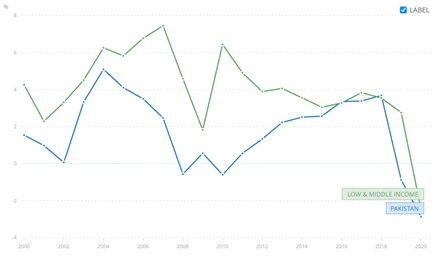
Source: WDI (2022)
Figure 3: Gross capital formation (% of GDP)
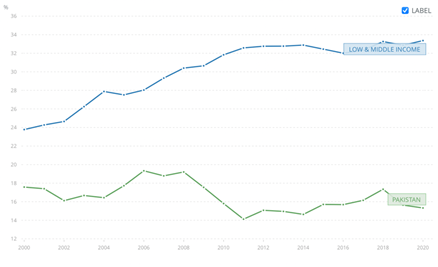
Source: WDI 2022
Figure 4: Gross domestic savings (% GDP)
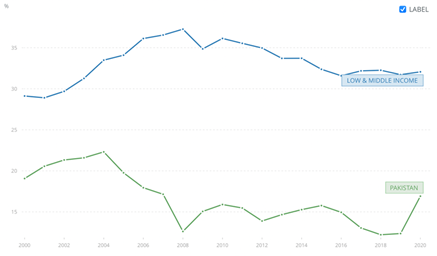
Source: WDI 2022
Figure 5: Consumer price index
Source: WDI (2022)
Figure 6: Exports of Goods and Services (% of GDP)
Source: WDI 2022
Structural transformation is another indicator of modern economic growth with the share of manufacturing linked to the rate of growth, to factor productivity, and in some cases as in several East Asian economies, to the share of exports (Figures 7&8)[8]. Likewise, the contribution of agriculture to GDP signals the stage a country is at with respect to structural transformation (Figure 9). Pakistan stands out on both counts. The share of manufacturing is far below the norm and that of agriculture is well above. Clearly the pace of change has been much too slow, and Pakistan has a lot of catching up to do. Where Pakistan leads other countries by a small margin is with respect to the percentage of manufactures in total exports and the reason in part is because resource-based products figure prominently in the exports of many other low- and middle-income countries (Figure 9). However, Pakistan’s manufactures are comprised of low-tech products with textiles and garments accounting for 60 percent of the total. The economic complexity ranking has declined since 2000 and among the most complex products Pakistan exports are knives, pliers and instruments for surgical and dental use (Figure 10)[9].
Figure 7: Manufacturing (% of GDP)
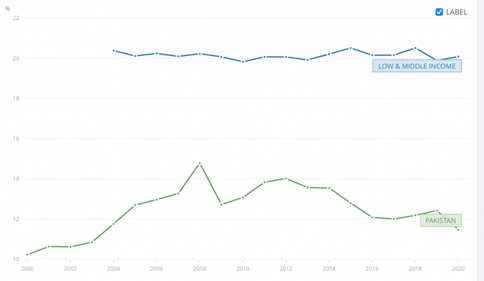
Source: WDI 2022
Figure 8: Agriculture share of value added in GDP (%)
Source: WDI (2022)
Figure 9: Manufactures exports (% of merchandize exports)
Source: WDI 2022
Figure 10: Economic complexity index
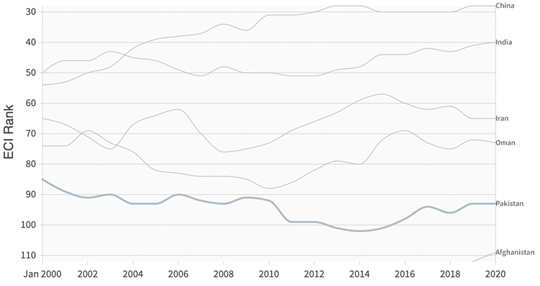
Source: https://oec.world/en/profile/country/pak
A few social indicators can also highlight the level of development. Labor force participation shows both how much opportunity the economy provides for job seekers and their capacity to bid for the jobs on offer. Overall participation in Pakistan has stagnated at around 50 percent and while the gap between its rate and that of other countries has narrowed, this is because participation elsewhere fell by about six percentage points to 59 percent (Figure 11). Alongside participation in the aggregate, the increased participation of women in the labor force is viewed as one marker of progress and shows how effectively a country is mobilizing a key resource. Pakistan’s female participation rate after rising through 2015 has fallen back to an extremely low 21 percent, nearly 23 percentage points less than the average for comparators and one of the lowest in the world (Figure 12)[10].
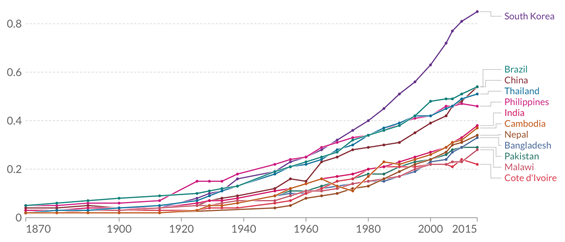
With fewer women entering the workforce, it is not surprising that Pakistan remains at some distance from the demographic transition already occurring in neighboring countries and in most other middle-income economies. A fertility rate of 3.4 in 2020, is significantly higher than 2.5 average for others in the income category (Figure 13). Other indicators of social development also set Pakistan apart from the rest. Life expectancy at birth is 67 years in Pakistan while it is 71 years in comparators and the rate of increase is slower than the rest so that the gap could widen (Figure 14)[11]. The Index of Human Development only reinforces the impression that Pakistan’s ascent up the ladder of development has been unusually slow (Figure 15)[12]. It has almost the same ranking as Malawi one of the world’s poorest countries with a per capita income of $637 half that of Pakistan’s in 2020.
Figure 11: Labor force participation rate
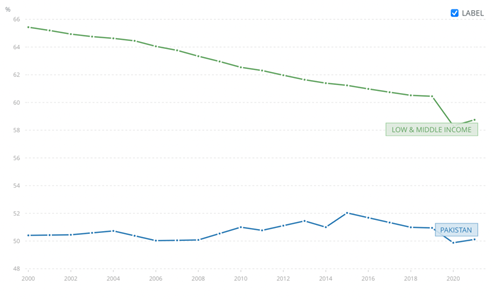
Source: WDI 2022
Figure 12: Female labor force participation rate (% of female population)
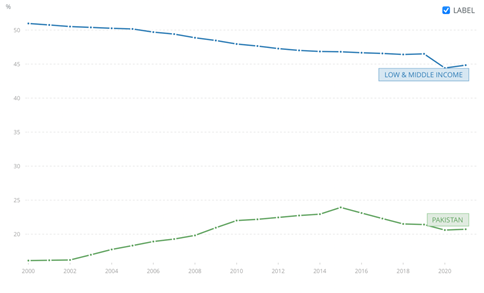
Source: WDI (2022)
Figure 13: Fertility rate (births per woman)
Source: WDI 2022
Figure 14: Life expectancy at birth
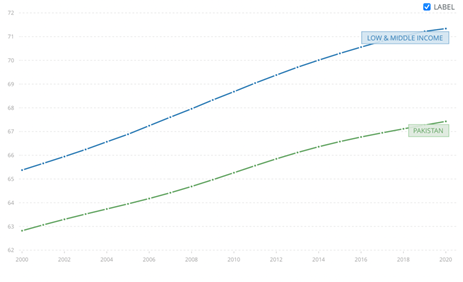
Source: WDI 2022
Figure 15: Historical Index of Human Development 1870-2015
In light of the above, it is not surprising that GDP per employed person has barely risen in Pakistan and appears to have plateaued since 2018. Meanwhile the output of the employed elsewhere has climbed steadily and now averages $26,000 whereas each worker in Pakistan only generates $14,666 (Figure 16).
Figure 16: GDP per person employed (constant 2017 PPP $)
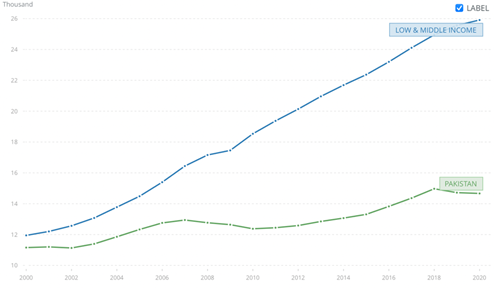
Source: WDI 2022
Is Pakistan an economy trending towards the norm for low- and middle-income economies? These indicators suggest that it has fallen far behind the rest, has missed out on the advantages supposedly available to latecomers[13], has not benefitted from the demographic bulge, and risks being irretrievably trapped in a low-level equilibrium absent major policy interventions that accelerate structural change and imbue the economy with the dynamism it has lacked.
In the medium-term Pakistan must come to grips with the fallout from the Covid 19 pandemic[14] and the conflict in Europe. The former is responsible for rising debt burdens, pressure on public services, falling household incomes, and higher prices. The latter has compounded these problems by sharply increasing the cost of energy and grain and widening the trade deficit[15].
Over the longer run, a potentially slowbalizing global economy and rising climatic headwinds will make the needed structural changes and measures to enhance the potential growth rate both more challenging and more urgent. The gaps identified above need to be not just narrowed, instead Pakistan must pull ahead of the average in order to make up for lost time. This will require a major change in elite mindsets and horizons[16]. A decisive pivot from rent seeking and a focus on promoting private interests to a commitment to long term developmental goals, is becoming an inescapable necessity[17].
Dr. Shahid Yusuf is Chief economist, Growth Dialogue and Non-resident Fellow, Center for Global Development. Thanks to Masood Ahmed for insightful suggestions
[1] https://www.worldbank.org/en/news/press-release/2022/06/07/stagflation-risk-rises-amid-sharp-slowdown-in-growth-energy-markets; https://www.oecd.org/economic-outlook/; https://www.wto.org/english/news_e/pres22_e/pr902_e.htm
[2] https://www.ft.com/content/6f379a95-21e0-4d25-ba09-c91b1432c584; https://blogs.imf.org/2022/04/11/dangerous-global-debt-burden-requires-decisive-cooperation/
[3] S. Kuznets (1966) Modern Economic Growth. Yale University Press.
[4] “First.. are the high rates of growth of per capita product and of population in the developed countries…Second, the rate of rise in productivity, i.e. of output per unit of all inputs, is high, even when we include among inputs other factors in addition to labor, the major productive factor…Third, the rate of structural transformation of the economy is high…including e.g. the shift away from agriculture to non-agricultural pursuits and, recently, away from industry to services. …Fourth, the closely related and extremely important structures of society and its ideology have also changed rapidly…[e.g.] urbanization and secularization… Fifth, the economically developed countries, by means of the increased power of technology, particularly in transport and communication, have the propensity to reach out to the rest of the world [i.e. initiate globalization]. Sixth, the spread of modern economic growth, despite its worldwide partial effects, is limited in that the economic performance in countries accounting for three-quarters of world population still falls far short of the minimum levels feasible with the potential of modern technology.” S. Kuznets (1971). Nobel Lecture https://www.nobelprize.org/prizes/economic-sciences/1971/kuznets/lecture/
[5] H. Chenery and M. Syrquin (1989) Three decades of industrialization. https://documents1.worldbank.org/curated/en/887781468766222564/pdf/multi-page.pdf
[6] H. Chenery (1971) Growth and structural change. https://www.elibrary.imf.org/view/journals/022/0008/003/article-A003-en.xml
[7] The interest in “normality” is deeply rooted. For example, see A. Shleifer and D. Treisman (2005) A normal country: Russia after communism. https://www.aeaweb.org/articles?id=10.1257/0895330053147949; After major disruptions such as the Financial Crisis of 2008-09 and the Covid pandemic, the search begins for a “new normal”. https://blogs.worldbank.org/psd/long-road-new-normal-economy; https://sloanreview.mit.edu/article/a-long-time-until-the-economic-new-normal/; https://www.mckinsey.com/business-functions/strategy-and-corporate-finance/our-insights/the-new-normal
[8] This hearkens back to Kaldor’s first law that the growth of manufacturing correlates with GDP growth. The second Kaldor-Verdoorn Law maintained that the rate of growth of manufacturing is correlated with improvements in industrial labor productivity. N. Marconi et al (2016) Manufacturing and economic development. https://www.sciencedirect.com/science/article/abs/pii/S0954349X15000788; A.P. Thirlwall (1983) A plain man’s guide to Kaldor’s growth laws. https://www.jstor.org/stable/4537750
[9] https://oec.world/en/profile/country/pak
[10] Female participation in the urban sector is just 10 percent and has remained static since the turn of the century. https://blogs.worldbank.org/endpovertyinsouthasia/pakistan-womens-representation-workforce-remains-low
[11] Infant mortality at birth, while trending downward was 54 per 1,000 live births in 2020 as against 30 per thousand live births in low- and middle-income comparators and 47 per thousand in low-income countries. https://data.worldbank.org/indicator/SP.DYN.IMRT.IN?locations=PK-XM
[12] This squares with Pakistan’s literacy rate for the adult population – 58 percent in 2019 vs. 85 percent for low- and middle-income countries. One reason is that Pakistan has the second highest number of out of school children according to UNICEF. “Gaps in service provision at all education levels is a major constraint to education access. Socio-cultural demand-side barriers combined with economic factors and supply-related issues (such as availability of school facility), together hamper access and retention of certain marginalized groups, in particular adolescent girls. At systems level, inadequate financing, limited enforcement of policy commitments and challenges in equitable implementation impede reaching the most disadvantaged.” https://www.unicef.org/pakistan/education
[13] Latecomers must be quick and agile if they are to exploit the advantages of a late start, and when it comes to greening the economy, delay can be costly. J.A. Mathews (2006) Catch-up strategies and the latecomer effect in industrial development. https://www.researchgate.net/publication/247516476_Catch-up_strategies_and_the_latecomer_effect_in_industrial_development; A. Pegels and T. Altenburg (2020) Latecomer development in a greening world. https://www.sciencedirect.com/science/article/pii/S0305750X20302102
[14] R. Rashid et al (2021) Socioeconomic and environmental impacts of the Covid 19 pandemic in Pakistan: An integrated analysis. https://pubmed.ncbi.nlm.nih.gov/33410007/
[15] The trade deficit during the first 10 months the FY21/22 was $39.3 billion. https://tribune.com.pk/story/2355484/trade-deficit-peaks-at-393-billion; Between July 2021 and March 2022, the rupee depreciated 14.3 percent against the dollar and the downward slide continued through May 2022. https://www.worldbank.org/en/country/pakistan/overview#1; The WTO has revised downward its projected growth rates for trade during 2022-2023 – the trade doldrums caused by the European conflict have been exacerbated by lockdowns in China. https://www.wto.org/english/news_e/pres22_e/pr902_e.htm. This could dampen Pakistan’s export prospects.
[16] James Robinson (1999) has this take on the predatory behavior of elites. “The incidence of bad policy is puzzling because even self-serving regimes would have an incentive to promote development if they could extract enough of the resulting wealth…. [A] key reason why such a government may not choose a policy, which promotes development is that such policies affect the distribution of political power in society. This may change the subsequent political equilibrium in a way which may be disadvantageous so that the elite may benefit more from retaining political power than from promoting development.” When is a state predatory? https://www.econstor.eu/bitstream/10419/75563/1/cesifo_wp178.pdf In his recent book (S. Dercon (2022) Gambling for Development) Dercon argues that “successful growth and development requires the presence of a development bargain – that is an underlying commitment to growth and development by members of the country’s elite (the people within the fabric of society, the economy, and politics who make decisions or can disproportionately influence them)….China’s success came about because of a shift after 1979 towards a fundamental commitment by its leaders…It was a gamble, no doubt, and it could have backfired economically or politically.”
[17] A. Amsden et al (2009) Aligning elites with development. https://www.wider.unu.edu/publication/aligning-elites-development